|
|
|
Webapps
While scientific computing and analysis are often conducted with standalone applications, the web offers a convenient platform for designing and deploying applications that are ubiquitous, platform independent and easy to use. With this in mind, the following example web applications offer an alternative to traditional analysis tools.
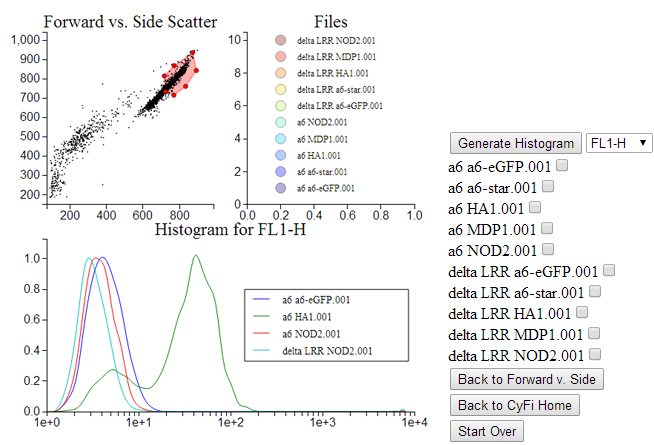
Online flow cytometry plotting: Upload and analyze flow cytometry data. Allows interactive gating and generates 1D histogram and 2D scatter plots. Download from Github (https://github.com/sheldonpark/cyfiplot).
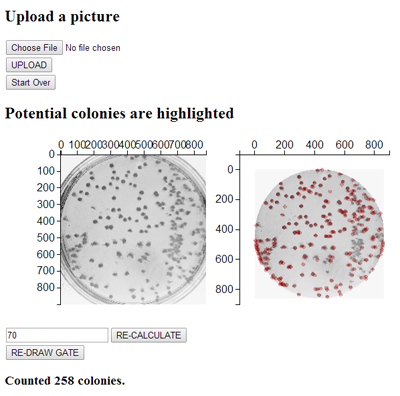
Colony finder: Upload the picture of a bacterial/yeast plate and count (estimate) the number of colonies. Adjust the threshold to get the best estimate.
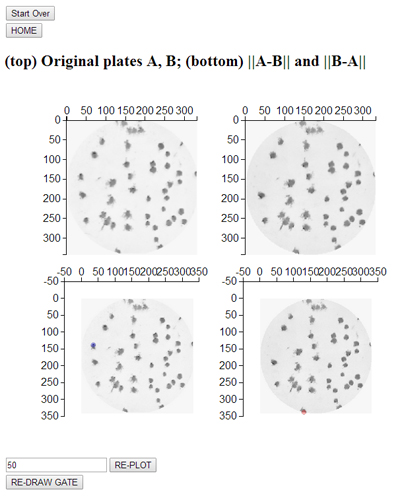
Replica plating comparion: Upload two pictures of replica plates (i.e. two plates grown under slightly different growth conditions) and identify colonies that are missing in one or the other. The "missing" colonies are highlighted in blue (left) and red( right). The threshold can be adjusted to get the best result.
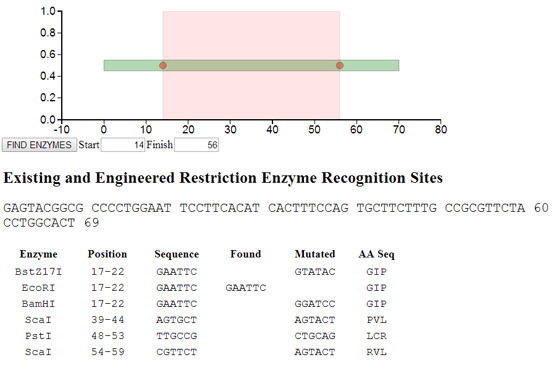
Engineer restriction enzyme recognition sites: Enter a DNA sequence. Silent mutations will be introduced to engineer novel restriction enzyme recognition sites.
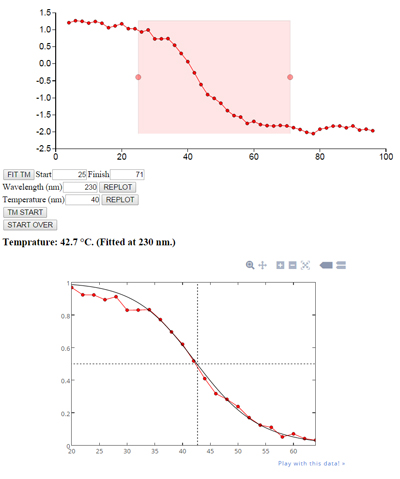
Fit denaturation temperature: Upload .xlsx, .csv, or .txt file containing circular dichroism data (at different temperatures and wavelengths) and fit the denaturation transition to computing the melting temperature Tm. Plot is generated using "plot.ly".
(Sample input data: Temperature across the top, wavelength from 250 nm down in increments of 0.1 nm. Wavelength information is not included in the file.)
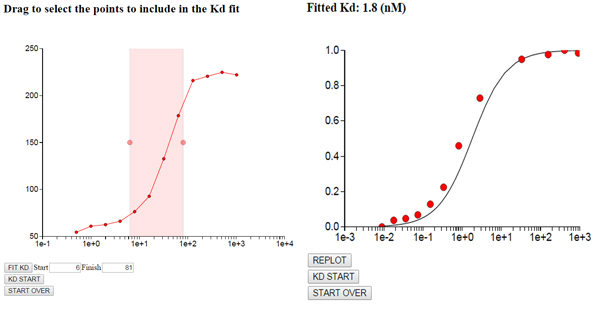
Fit binding constant Kd: Copy the binding data into the textarea and select a range containing to include in the fit. Optimum Kd value is computing using the quadratic equation.
|